Next: 1.3 Color Temperature Up: 1.2 Chromatic Light Previous: 1.2.1 Psychophysics
The negative values in the representation of color by R-G-B-values is unpleasant. Thus
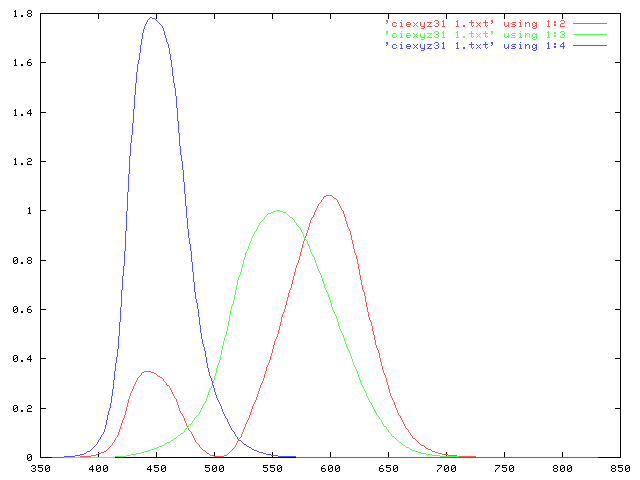
the Commission Internationale de l'Éclairage (CIE) defined in 1931 another base in terms of
(virtual) primaries ![]() , (the luminous-efficiency function)
, (the luminous-efficiency function) ![]() and
and ![]() ,
which allows to match all visible colors as linear combinations with positive coefficients only
(the so called CHROMATICITY VALUES
,
which allows to match all visible colors as linear combinations with positive coefficients only
(the so called CHROMATICITY VALUES ![]() ),
i.e. any visible color
),
i.e. any visible color ![]() can be expressed as
can be expressed as
![]() ,
see
,
see
Normalization to ![]() gives new coordinates
gives new coordinates ![]() ,
, ![]() (and
(and ![]() ),
which are independent on luminous energy
),
which are independent on luminous energy ![]() .
The visible chromatic values in this coordinate system form a
horseshoe shaped region, with
the spectrally pure colors on the curved boundary.
Warning: brown is orange-red at very low luminance (hence is not shown in this diagram).
Standard white light (approximative sunlight) is located at point
.
The visible chromatic values in this coordinate system form a
horseshoe shaped region, with
the spectrally pure colors on the curved boundary.
Warning: brown is orange-red at very low luminance (hence is not shown in this diagram).
Standard white light (approximative sunlight) is located at point ![]() near
near ![]() .
.
 |
![\includegraphics[width=0.45\textwidth]{cie_4-inv}](img84.png) |
The DOMINANT WAVELENGTH of some color
is given by the intersection of the ray
from ![]() to the color
with the curved boundary formed by the pure colors.
to the color
with the curved boundary formed by the pure colors.
Some colors (purples and magentas) are non-spectral, i.e. have no dominant wavelength (since the intersection of the rays hit the boundary in the flat part). But they have have a COMPLEMENTARY DOMINANT WAVELENGTH, lying on the opposite side.
COLOR COMPLEMENTARY to some color are opposite to
![]() on the line through
on the line through ![]() . E.g. we have the following complementary pairs:
red-cyan, green-magenta, and blue-yellow.
. E.g. we have the following complementary pairs:
red-cyan, green-magenta, and blue-yellow.
EXCITATION PURITY is a ratio of the distances
from the color and the dominant wavelength to ![]() .
.
The CIE chromaticity diagram can also be used to visualize the COLOR GAMUTS (i.e. the ranges of producible colors) for various output devices:
 |
The chromaticity values for standard NTSC RGB phosphor are:
| R | G | B | |
| x | 0.67 | 0.21 | 0.14 |
| y | 0.33 | 0.71 | 0.08 |
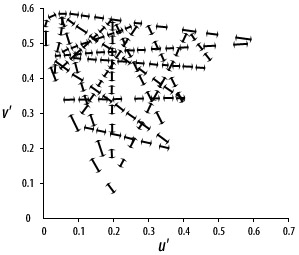
A disadvantage of the CIE 1931 standard is that equal distances in the ![]() coordinates
are not perceived as being equal. This was corrected by 1976 CIE LUV standard.
coordinates
are not perceived as being equal. This was corrected by 1976 CIE LUV standard.
![\includegraphics[width=0.45\textwidth]{CIE1960-inv}](img91.png)
![\includegraphics[width=0.45\textwidth]{CIE1976-inv}](img92.png) |
![\includegraphics[width=0.45\textwidth]{cie_luv1960-inv}](img93.png) |
![\includegraphics[width=0.45\textwidth]{cieluv-inv}](img94.png) |
Andreas Kriegl 2003-07-23
![\includegraphics[]{13-25}](img85.png)
![\includegraphics[width=0.45\textwidth]{ppmcie-ebu}](img86.png)
![\includegraphics[width=0.45\textwidth]{ppmcie-ntsc}](img87.png)
![\includegraphics[width=0.45\textwidth]{ppmcie-hdtv}](img88.png)
![\includegraphics[width=0.45\textwidth]{ppmcie-uv-ebu}](img90.png)